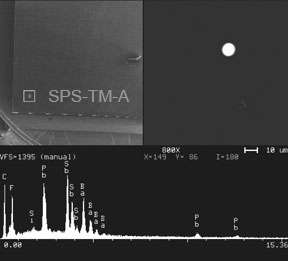
It is recommended that the BSE signal of the SEM is used for imaging the particles since this a high contrast signal difference between the Pb/Ba/Sb particles and the glassy carbon substrate. Beam current of the SEM should not exceed 2 nA.
Instructions are supplied with the SPS test specimen. For the evaluation of the automated GSR measurements it is recommend that the data obtained from the Pb/Ba/Sb particles (in particular their X-Y coordinates and the particle size) is displayed as an X-Y plot. When using an appropriate display area, a direct comparison can be made of the positions and the size of the detected particles with the particle matrix.
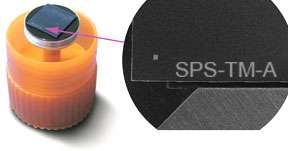
Test specimen for checking and validating automated particle analysis using SEM/EDX systems
This test specimen has 15 lines of particles with different sizes with 20 particles spaced equally per line. With the known particle sizes and positions this test specimen can be used to test and validate SEM/EDX systems used for automated particle analysis applications.
Short test sample description:
- 10 lines x 20 particles point matrix
- 20 particles of the same size are on a virtual line, equally spaced by 150µm
- Particles sizes are 2.0 / 1.8 / 1.6 / 1.5 / 1.4 /1.3 / 1.2 / 1.1 / 1.0 / 0.9 / 0.8 / 0.7 / 0.6 / 0.5 and 0.4µm (some particles can be missing)
- Each size category is labeled at the beginning of the line
- Multilayer structure with PbO / BaF2 and Sb2O3 particles
- Glassy carbon substrate
- Each test specimen holds two sets of the 10 x 20 point matrix.
This test specimen is particularly useful for calibration of fields/SEM stage, particle measurements/classification, EDX analysis and to correct to overlap, gaps and rotation of the fields. It is also useful for aligning the scan rotation with the X/Y movements of the SEM stage.